 |
| Dustin Lance Black storyboarding |
by
Writing For Research, Medium:
https://medium.com/advice-and-help-in-authoring-a-phd-or-non-fiction/story-boarding-research-b430cebd5ccd#.7l6e0fr5w
Almost
everyone doing research makes a plan before getting started - because
we all know that research is time consuming, often expensive and hard to
predict.
Nowadays too this is often accompanied by some simple project
management stuff - usually a
Gant chart
with tasks sketched in.
If it’s a one person project this just parcels
our blocks of weeks to topics; bit n a group project it allocates both
time blocks and people or sub-teams to different tasks. Critical
deadlines for deliverables are included here.
These
plans always include some unrealistically short time for ‘writing up’
after ‘doing the research’ is complete. But what that actually means in
terms of how a report or article will be organized is often sketched out
only in very formal or conventional terms (you know, the kind of
completely useless ‘structure’ that goes: Introduction, then
Definitions, Literature Review, Methods, Data, Data Problems, Analysis,
Conclusion).
The key thing here is that you read the plan and are no
wiser at all about what the report or article will actually
say.
In group or team projects there’s often a lot of rather abstract
negotiation(sometimes fierce argument) about the plan and project
schedule, plus the allocation of tasks. The amount of final text space
to be given to each person’s aspect of the work is especially tussled
over.
Then the
researcher (or everyone in the team) gets to work … and the plan
usually crumbles on first contact with research realities. What was
envisaged proves more difficult or time-consuming, or yields only
‘obvious’ results, or things apparently dis-confirming the main initial
hypotheses.
Previous literature supposed to be there proves elusive or
useless. Experiments misfire and have to be redesigned. Archives are
hard to reach and take more time to understand than planned.
Interviewees don’t respond to requests to talk, and survey forms are
unreturned. Statistics or data prove much resistant to analysis than
expected.
Meanwhile
the plan is not revised, but instead just atrophies. At meetings in
team projects the leaders struggle to keep some progress going and
everyone busy and committed, but some team members get overloaded and
others are under-occupied. Usually the plan is too fixed and high-level
to be easily redone, except with ad hoc fixes in periodic meetings.
In
teams each member or sub-group often focuses down on what they’re doing,
losing the bigger picture and trying to just deliver what they
promised, with meetings just hurdles to weather not a pooling of minds
or information. In individual projects the overall picture of the report
or article or chapter gets fuzzed, with the researcher plugging on, now
with much less of a plot. Through it all the project burns time and
money, but gets less defined until …
… the
end of the year, or some other fixed deadline looms, or the client for
paid projects demands an update prior to the final deliverables. Cue a
mad rush to get ‘writing up’ done. The formal headings of six months or a
year ago are dug out, and some harsh realities are faced with hand
deletions of sections that now are not viable. Chunks of text that could
have been written months ago (but were n’t) are finally committed to
screen or paper.
The researcher or the team now burns the midnight oil
in a frenzy, rush-producing results and findings, hustling statistics
and Stata outputs (correct to 7 decimal points) into giant, disorganized
tables. Much that should be better done is not. Individual authors just
don’t have the time to improve the writing.
And in teams, members are
mostly too exhausted or time-poor to comment on (let alone fight over)
other folks’ weak sections - unless some control freak (willing to work
all hours) seizes the moment to re-architect the text in a more coherent
way despite the arguments that this generates.
I
hope this picture is familiar, not because I wish bad things for you,
but because I don’t want my own multiple experiences of my own and other
people’s weak and fragile project planning to be too exceptional. And
because storyboarding research can help.
What is storyboarding and why does it work?
‘A film storyboard’, according to
Wikipedia, ‘is essentially a large comic of the film or some section of the film produced beforehand to help
film
directors, cinematographers and television commercial advertising
clients visualize the scenes and find potential problems before they
occur. Besides this storyboards also help estimate the cost of the
overall production and saves time. Often storyboards include arrows or
instructions that indicate movement’.
If
you’re planning a video, a TV commercial, a film, or even a theatre
production, you know will be a long or costly project. And it will
inherently entail a concentrated creative effort, during which initial
plans are likely to chop and change, a lot.
So a storyboard is usefully
because it is literally just a comprehensive set of rough sketches on
paper. It takes us - scene by scene, or even shot by shot - through what
this version of the plan (of multiple versions) says will happen.
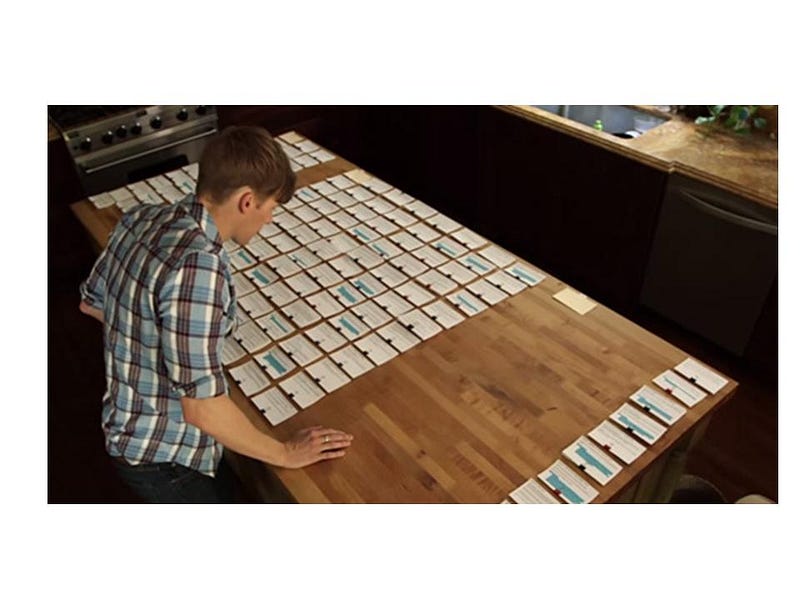
Often
storyboards include key image ideas, scenery or landscape concepts, or
set design ideas, as well as bits of dialogue for vritical ‘turning
points’ in the plot, or partial dialogue cores for scenes. These then
get fleshed out, perhaps leading through a stage where there are dozens
of plot index cards, as shown in the header photo for this article
(this shows Oscar-winning screen writer Dustin Lance Black, hard at work
on a movie screenplay, being built up from many index cards. He
brilliantly
explains his practice here).
Storyboarding works because
(i) It helps
envision, or picture in miniature, and long in advance, a finished product, allowing all those in a project involved to begin mentally run, rerun and debug each scene or angle.
(ii) Storyboarding is
a kind of low-cost prototyping,
a way of making more concrete what will happen. It seeks to generate
key reactions and ideas to a very expensive product before a mass of
scarce resources and money are expended on building the vision at full
scale.
(iii) Because concepts are fleshed out and made concrete in an accessible way, a storyboard can help
generate resources and commitment from external source. In
movies raising finance from investors, or in advertising securing
agreement from clients, are key stages before the full project can go
ahead.
(iv) Looking ahead in this way can also help a lot in
realistically costing what it will take to implement ideas in time and money terms.
(v) A storyboard helps
creatively develop difficult materials,
in enterprises where fine details and the exact form of implementation
of ideas are key. In some contexts (like adverts or music videos) the
storyboard may be the only ‘shooting script’ that exists before
production. In longer films it often metamorphoses into a contingent
screenplay, that is itself often revised.
(v) The storyboard (and later the screenplay)
generate a detailed, common vision that
can be shared early on by many different actors in complex production
teams - writers, directors, actors, camera people, multiple designers
and technicians. From an early stage a storyboards gets everyone on the
same page, in a ‘blow by blow’ way that is easily updated and
reformulated. So long as it expands and adapts, it can also help keep
them there as the project constantly evolves.
Why storyboarding also helps in doing research
Completing
a research project, or doing a PhD, may seem a long way away from
creative film- or video-making? So why should a method from such a
remote line of activity be useful to scholars, scientists and academics?
In fact
prototyping research
is just as valuable in research contexts, as it is in a wide range of
business and science contexts. ‘Prototyping’ is building any kind of
cheap and easy-to- make simulacrum of a final product at a very early
stage in its production, especailly the stage of deciding what to try to
produce.
Protoyping can extend to building something a bit fancier, a
‘minimum viable product’ in business-speak, that can do some of the key
functions of the intended final product. Prototyping saves time and
money being spent on things that won’t work; or that won’t be acceptable
in the form envisaged; or that have flaw or problems that only become
manifest when we try to make them even a bit more concrete.
Prototypes
often fail, but mostly in a particular kind of way, one where ideas are
‘pivoted’ - significantly modified or re-orientated in what the product
is trying to do, rather than abandoned altogether.
Scientific
and academic researchers often neglect to create prototypes. The ethos
of ‘research’ tends to assume that we don’t know what the answers are at
the start, and so should avoid preconceptions. The feeling often in
that (in some obscure way) it would be biasing to try and look forward
to possible answers or outcomes from research before it gets done. The
temptation then is to get your head down, get on with assembling
materials to ‘test’ the research ‘hypotheses’ and see what happens - not
‘waste time speculating’ about what the ‘findings’ may turn out to be.
This
“Don’t look ahead” stance is perhaps especially common amongst new
researchers (PhDers especially, because they have a fixed task to
complete in a fixed three or four years). But it also occurs amongst
experienced researchers working alone, who are perhaps least likely to
articulate in advance what they hope to find.
One reason why academics
who co-author with other people have more citations may well be that
having to talk about the research and allocate tasks produces more
looking ahead and prototyping. Not doing prototypes, and just getting
stuck into a research grind, can also be a syndrome in teams with a very
well-known or protracted timetable to complete a research grant or a
consultancy brief for a client.
Visualizing your final product
is also invaluable in research contexts, and again storyboarding
directly helps here. The benefits for scientists and academics include:
- Triggering a cumulation of ideas
early enough to help shape the research process, rather than these
being just unanswered questions left dangling in the ‘writing up’. One
paragraph tends to suggest another, perhaps a possible counter-argument,
and that in turn may suggest a rebuttal argument. None of this is
obvious before the first paragraph gets written. Similarly, looking hard
at a completed chart or table almost always reveals patterns (or
possible interpretations) highlighting a need for another chart or
table.
- Facing up to inconsistencies.
We all have a strong natural capability to maintain contradictory ideas
or arguments in our private thinking, or even in oral expositions and
conversations. Writing out arguments, or otherwise visualizing outputs
or deliverables in concrete ways, helps counteract maintaining
inconsistent inconsistent commitments and arguments. Committing ideas to
screen or to paper forces you to face up to weaknesses, refine
arguments to avoid problems, or fashion counter-responses or potential
solutions for things that seem to clash.
- Avoiding procrastination by
encouraging researchers to complete known requirements as soon as they
feasibly can. If you can foresee that it will take two paragraphs to
explain Concept A; or a sub-section must explain Method X; or that a
data table will be needed on aspect G — well, why not get that
written/done now, instead of in a mad rush at the end, or up against a
deadline?
- Focusing on a research narrative,
early on. Although a storyboard must includes critical, substantive
details, it also focuses on getting across overall messages in an
accessible way. For a research project, article or PhD chapter a
storyboard directs your attention relentlessly to the value-added of the
research, the key findings and conclusions, the ‘bottom line’ argument.
- Filling the otherwise large gap between initial plans and producing a first draft
of the report, article or chapter. Storyboarding is about envisioning
research. It asks: ‘If everything went as well as it could (given
initial expectations), what would I find out or end up arguing?’ Or:
‘What if things went “badly”- in the sense of diverging a lot from
initial expectations? or showing that I do not really understand what
was going on? or that things are just more complex than I thought? What
then would the argument be?’ ‘Are there any intermediate outputs,
findings or results that I can bank for sure? Or anything that can offer
me some “insurance” benefit, something to “lay off” against the largest
risks of things going awry?’
How storyboarding tackles the mid-stages of text production
Between
the plan and the first draft falls the storyboard. Plans are gnomic and
often vague, no more than a set of skeletal stages to be filled in only
later. A storyboard by contrast focuses on fulfillment, on anticipating
and ‘getting on the board’ now all that can already be anticipated. It
follows the (Theodore) Roosevelt doctrine of ‘Do what you can, where you
are with what you have’.
A plan is what you promise when you’re
applying for a grant or bidding for a research contract. The storyboard
is what you build as soon as you know you have the grant award or the
contract is in the bag, and the precise resources that entails.
A
plan is also a static thing, mechanical, inorganic and hence tending to
go out of date. Sometimes teams believe that simply articulating the
plan in great detail, defining a complex architecture - with formal
heading pyramided using organizer software, especially with multiply
numbered sections (like 2.1.1.a) - will be enough to keep a plan
relevant. But such plans just fail sooner and in multiple detailed ways.
Click on any element in a plan and there is normally nothing behind it.
By contrast a storyboard is organic and dynamic.
As soon as a component
can be sketched in, it is included. And as and when the sketch can be
filled out, then an image or summary of the completed component sits in
its place in the evolving overall structure. Click on any element in a
storyboard and there will be something lying behind it, depending on the
stage of development of that component of the report or article.
There are two key levels of storyboarding - early and full. An early research storyboard
is the equivalent of the initial cartoon version of a TV advert or
video. It is very short, but still narrative- or sequence-orientated;
still aiming to envision the finished research project in concrete,
substantive message terms. Gradually it should fill out and transform
towards the second stage.
A full research storyboard
expands to hold an image or some mini version of all the components of
the final text. What this especially means is that the storyboard shows
- all of the headings and sub-headings that will structure the analysis, given in full;
- at least quick verbal sketches of every main text section
- or perhaps later on, summaries of every main paragraph or groups of paragraphs;
- images of all long quotations; and
- versions of every
Figure, chart, table or case study boxes planned. At the beginning
these might just be made up sketch graphs instead of charts, or simple
pictures of a planned diagram, or a set of empty boxes that is the same
size as a planned table. With time these components get fleshed-out
(e.g. using interim data in tables, or just quickly drawn charts). Late
on they will be clickable images of the now finished exhibits.
All
these elements need to be organized into the same sequence that they
will be in in the finished text. And they must be easily moveable, so
that authors can experiment and see what would happen if the sequence
was rearranged, or if an element or two were just left out or
marginalized to an Annex.
Add
these two stages into normal academic and scientific procedures and you
get a six stage, active planning process that does not have the major
implementation gaps of conventional approaches:
Stage 1
Research Plan. This
includes the tendering phase in a consultancy research project or the
writing and submission stage in a research grant application.
Stage 2 E
arly storyboard. With
the feasible timelines and available resources now well-defined, how
exactly can the promises of the plan be delivered? What substantively
will be done and what messages given in each part of the man text
deliverable - the research report, or an article or chapter? What is not
yet known, must be anticipated or guessed at or visualized as far as
feasible. In cases of uncertainty consider possible scenarios.
Stage 3:
Full storyboard. This
is a long-lasting phase, operating throughout the main research
process. The structure is actively reviewed in the light of interim
findings and results so far. Any components that can be realized
immediately are put in place in miniature, as clickable images (so that
the storyboard remains readable), but in advanced, even final form so
that details can be easily reviewed.
Stage 4:
Rapid first draft.
This is a joined up write-up of the expanded storyboard, done quickly
in ‘blitzkrieg’ (go around any obstacles) mode. The aim is to get the
core arguments down, without worrying too much about their coherence,
let alone missing references or tables and charts that are not there
yet. Include the right amount of space for any missing component, and
its indicative storyboard image, but the go round it in developing the
overall argument. Generally this version of the text will be kept
private, because it still has necessary components missing and gaps
being filled in. But it can be shown to supervisors (with PhDs or
dissertations), and in consultancy it might be shared with clients too
(following a ‘no surprises’ policy). Getting such core feedback as early
as possible makes a really rapid first draft useful, because you still
have time to react, to pivot the argument a bit, and to do infill
research areas where gaps are spotted.
Stage 5:
Full text draft. Here
all the gaps are gone and readers get a view of the report or article
without annoying glitches and omissions. All the ‘i’s are dotted, the
‘t’s are crossed, the text references and bibliography match, and all
the exhibits and arguments are present in final or very-near-final form.
Above all this is the moment when the researcher or the research team
finally gets to see the report or article as a whole. This text can be
sent for wider commenting and reactions. And the authors can stand back
from the text, and try to get enough critical distance to spot flaws and
weak points - never easy when you are close to a just-written text.
Hopefully, with storyboarding, you can reach this stage a lot earlier
and less stressfully.
Stage 6:
Edit and revise to get a final text. Most writing is improved by making a 10 per cent cut. And both ‘
paragraph re-planning’ and less drastic forms of editing (like the ‘
build, blur, corrode’ test) can add a lot of value - especially if they are not being done in a rush, and most key issues have been solved already.
Storyboarding on PC or paper
How you do storyboarding, what system or mechanism you use, could vary a good deal. In general, story-boarding should be
- visual, letting you overview argument structures and sequences quickly
- easy to add new components to
- flexible so you can move stuff around and try out different sequences
- expandable, so that you can add in paragraphs, charts, tables, text boxes, photos, and whatever else you need
- operating
at two levels, one the overview mode with miniaturized elements that
are still viewable; and the other the full slide mode that lets you
click through to inspect any element in detail.
- ideally
the system should not entail any extra entry of headings, text or
exhibits. You should be able to easily copy across what you need from
the system you use for drafting full text.
Because
I do most of my writing on PC (bar the earliest ideas -planning stage
and the final text edit) the system I use a lot, and recommend to others
because it is so widely available is Powerpoint. Whatever its drawbacks
as a presentation system, the slide sorter view in Powerpoint is just
great for storyboarding.
Every component - headings, text paragraphs,
charts, tables - goes onto a slide of its own. It’s often best to copy
stuff onto slides in picture formats that can be easily re-sized -
certainly always put in images of charts, tables and diagrams this way.
You can control the size of the slide miniatures in the slide sort mode,
balancing the number of components in view at once, against how much of
that component is readable. Moving things around is easy to do and very
visual in the slide sorter , and it’s easy to keep an eye on the
narrative thrust.
As you go from a slim early storyboard to a fuller
version it may help to print out the slide sort view, and spread out
large printouts on a big dining table or pinboard to see the picture as a
whole.
For
research teams, using Powerpoint also makes ‘version control’
easier - because almost everyone already has the software, or a close
Apple or Google substitute. And storyboarding on PC means that files are
easily shareable via Dropbox or Google Drive. Everyone making changes
or additions needs to initial and renumber the title so as to save a
uniquely named version.
For team meetings book a committee room with a
big TV display or a PC projector. Then the whole team can gather round
each screen, perhaps using the giant Post It notes (the kind that stick
on any nearby wall) to scribble down changes or new ideas that can also
be kept visible to everyone.
Of
course, re-purposing Powerpoint in this way has some limitations,
chiefly the relentless linearity of its approach. This is the feature
that other presentation systems (like Prezzie) make such a big thing of
avoiding. Yet remember that in the end most reports, articles and
chapters will have to be read and reviewed linearly. So Powerpoint’s
linear approach may actually be better for this than Prezzie’s recursive
meanderings.
There are also specialist PC programs dedicated to the
idea-generating, ideas organizing and storyboarding task, and some seem
well liked by their users. For instance, the simplified,
author-orientated wordprocessor Scrivenor has a ‘corkboard’ mode that
tries to help you through the planning-to-drafting stage by replicating
many features of a physical corkboard. Perhaps anyone better informed
than me could
email me with suggestions and reviews of alternative systems.
The
big alternative to storyboarding is using paper and physical systems.
You need corkboards (like TV detectives use) or magnetic boards on the
walls here; or a big table to spread out and rearrange components on.
And you can write ideas out in different ways. Post-It notes now come in
different sizes and shapes, and some are arrowed to help convey
direction easily. Or you can just pin sheets of paper up or use magnetic
markers to hold them in place on whiteboards.
The main alternative is
to arrange index cards. This approach is perhaps the most expandable
version, especially if you have many repeating or similar elements, and
a standard format for covering key aspects.
Standing
up to look at elements on walls or tables, and physically move them
around, is probably good for your health (it combats what Neal
Stephenson calls the ‘
arsebestos’
threat that plagues deskbound writers, academics and scientists). It
may also help create the distance from your ideas that you need to think
through potential criticisms or alternative approaches. Standing up in
teams might also help energize thinking.
Who should use storyboarding most of all?
Anyone
handling long-term, expensive or complex research projects can gain a
lot from using a storyboarding approach. Especially if you’ve
experienced past problems of ‘writing up’ getting too end-loaded, too
rushed and compressed up close-to-deadlines, why not give this approach a
try? Everyone will need to evolve their own practice, that fits the
kinds of writing and research they do, the types of materials they
handle, and the things that are already going well or poorly.
Three
types of researchers can benefit disproportionately from adopting the
two-stage (early and full) storyboarding approach set out here:
- Large research teams. In
academic life that’s any three or more people working on the same
project, but it could mean teams of ten to twenty at the upper limit.
Just as with feature films, a live storyboard that is never allowed to
go out of date, greatly helps keep everyone on the same page. Its
presence always shortens meetings, since team members can review
progress in other sections for themselves - and thus ask better
questions and sustain more interactive discussions, rather than
listening to a whole set of ‘briefings’ for most of meetings. A
storyboard also helps pool ideas, letting someone working on topic A see
possible synergies or connections with what colleagues are doing or
finding in another area G. A storyboard also helps head off the ‘hiding’
of non-working results, or people ‘shirking’ in an easily reserchable
areas while colleagues facing harder going feel more and more stressed.
- PhDers and other students doing graduate dissertations
can also get more out of storyboarding. It gets them more easily into
the developmental rhythms needed for sustained academic work.
Storyboarding creates more materials to share with supervisors. And it
helps overcome the naive (‘first do the research, then just “write up”
in three months’) attitude that PhDers often have. By forcing people to
write up more as they go along, storyboarding builds greater realism
about the writing and creative process. And it gets people practicing
writing (or finishing tables and charts) much earlier on. It can also
link easily to the regular annual reporting of progress that PhDers and
dissertation writers are normally required to do. It gives supervisors
both a continuously up-to-date overview of the dissertation
macro-structure, and a context within which to set the chunks of work
being submitted to show annual progress.
- Graduate students doing group projects
can particularly gain from the approach. Compulsory projects are
increasingly common requirement in business and public policy schools,
especially in elite universities and post-experience courses like MBAs
and MPAs. Here group working over long time periods (e.g. 5 months for the MPA’s ‘capstone’ project
at LSE) is a core element of the degree. If you are supervising any
similar groups, or taking part in one, storyboarding helps a lot in
keeping efforts directed to a common goal. Such student groups don’t
have any formal hierarchic leadership, and hence are vulnerable to twin
threats of some degree of free-riding by some members and
over-committment/over-dominance by others. At the same time these
projects are normally being completed for real-life clients, for whom a
storyboard is a useful way of being updated. Initially the student group
should evolve a very rudimentary storyboard to take forward the TOR
(Terms of Reference) document with the client in an initial meeting. In
the middle of the project a full storyboard using interim results and
conclusions can be a key document for a productive ‘course correction’
meeting. It lets one or two client personnel react to emerging findings
and lines of argument, and give feedback on whether or not it meets
their needs. This usually firms up how the final drafting takes place,
and suggests ways of proceeding to the final presentation and report to a
full client audience.
I sincerely thank Esther Bunny f
or
her really helpful responses to an earlier Twitter request for people
to tell me how they use storyboarding. I’d be very grateful if anyone
else with relevant or experiences or suggestions to share could email me, especially from research fields I may know little about.
 by The Onion: http://www.theonion.com/article/teary-eyed-student-loan-officers-proudly-watch-200-52895