Showing posts with label Education System. Show all posts

Monday, August 9, 2021

The PhD: Five Top Tips for Upgrade Success

by Ellie King, PhD Life:  https://phdlife.warwick.ac.uk/2021/07/28/five-top-tips-for-upgrade-success/

All PhD students have to do an upgrade review. Read below for blogger Ellie’s top tips for your upgrade success.

Apart from your thesis, your upgrade report is one of the most important pieces of work you’ll need to do for your PhD. At Warwick, in your first year you’re registered as a Research Masters student, and it’s only after your upgrade that you’ll be upgraded to a full PhD student status. But, there’s nothing to worry about with this piece of work and its accompanying review meeting. Here are my top 5 tips for upgrade success.

Know what your reviewers want

Your upgrade involves a written report, varying between 4000 and 10,000 words depending on your department, plus an hour or so long meeting with two reviewers (usually two related academics within your department). These reports and meetings can vary massively between departments and even between individual reviewers, so it’s important to know exactly what is required of you. For your report, follow your department’s guidance – they usually have information on their website or even hold an information session for you.

For the review part, you’ll find out who your reviewers are prior to the meeting. These meetings can vary wildly – my meeting was quite a rigorous viva-style defence of my work, but my fellow course mate had to prepare a 15-minute presentation of their work. So, once you know who your reviewers are, send them an email introducing yourself and asking if you need to prepare anything specific. Knowing what to expect will make your upgrade a lot easier to prepare for.

You’re not meant to know everything

Your upgrade usually takes place around one year (or part-time equivalent) since you started your work. Rest assured, you are not expected to know everything by this time. The upgrade is not a viva (although in my personal experience it really felt like one). You’re not meant to know all the answers at the point, but you are meant to be asking the right questions. This is the ideal place to be at the one year mark – an idea of the literature of your subject, a good set of questions you want to ask, and an idea about how you’re going to answer them.

Nobody wants you to fail

In preparation for your upgrade, you’ll have heard the various outcomes available: a pass, a resubmission, a recommendation to complete the research at an MRes level, or a withdrawal. This sounds incredibly scary, but in reality the outcomes are very flexible and are designed to ensure the right course is taken for you. It is highly unlikely that you will be asked to withdraw, and it is very rare to hear students at Warwick ‘failing’ their upgrade. It’s even more important to remember that NOBODY WANTS YOU TO FAIL. The upgrade review is not there to catch you out and show up your inabilities, it’s there to ensure you have everything you need – the guidance, the skills, the support – to complete your research. If things aren’t quite in place, the upgrade is an opportunity to review and revise your plans to ensure you’re most likely to succeed. It’s not a bad thing either if you’re asked to resubmit – I did and it really helped me clarify what I was doing.

Use it as an opportunity

Following on from this, it’s important not the see the upgrade as a test, but rather as an opportunity. Your first year is often filled with lots of different readings, ideas, and plans, and so writing the report is a good chance to sit down and take stock of everything you know and where you’re up to. It helps you get your ducks in a row for when research really ramps up during second year. It’s also a great chance to have other people look at your work and give you their thoughts. Your reviewers will be subject experts in a related field and will have lots of experience and advice. Use this opportunity to tap into that: ask them about potential ideas you have, what they think the best approach for a bit of research is, or if they can recommend any papers you may have missed. The review meeting feels like it should be the reviewers asking you questions, but you can turn this around. Ask them questions too – it’s a rare opportunity to have two (often senior) academics really focus on your work and give it attention. Use that time wisely.

Look Smart, Think Smart

This may sound very daft, but my last piece of advice is about how you present yourself. This mantra of ‘look smart think smart’ helped me through many years of exams – I felt that if I wore something smart I would take the day more seriously and it really helped me concentrate. I’m not saying you have to do the same, because the most important thing is for you to feel comfortable in yourself. But, this is probably the most formal situation of your PhD, apart from your final viva, and you should really treat it as such. Presenting yourself well and showing that you care about the event is important, it shows your examiners that you care about your work too. It may also give you confidence to talk about your work with gravitas, and that’s important too.

So, those are my top tips for upgrade success. Do you have any others you’ve found are helpful? Tweet us at @ResearchEx, email us at libraryblogs@warwick.ac.uk, or leave a comment below.

by Ellie

Ellie King is a Second Year PhD student in Warwick Manufacturing Group. She has been at Warwick since 2014 in the History department, and has recently moved faculties to research applying user experience to the museum sector. Ellie is partnered with the Oxford University Museum of Natural History. You can connect with her on LinkedIn here, or follow her on Twitter @ellietheking

Monday, April 26, 2021

Australia’s universities dominate global impact rankings

by Brendan O'Malley, University World News: https://www.universityworldnews.com/post.php?story=20210421154215704

Image: timeshighereducation.com

The University of Manchester in the United Kingdom has topped a table of more than 1,100 universities around the world on action towards the United Nations’ Sustainable Development Goals (SDGs), according to the third edition of the annual Times Higher Education (THE) Impact Rankings, released on 21 April.

But in terms of higher education systems, Australia is the world leader, with its universities claiming four positions in the overall ranking top 10, three more than any other country or region.

In total, 17 universities from 10 different countries and regions claim a top position across the 18 rankings, including Mexico, Thailand, South Africa and Saudi Arabia.

The rankings assess university commitment to sustainability at an institutional, local, national, regional and global level, from carbon neutral campuses to global partnerships responding to the COVID-19 pandemic at a multi-national level.

Launched in 2019, the Impact Rankings are the first global attempt to measure university progress towards the 17 SDGs, providing a total of 18 rankings, one for each SDG as well as an overall table.

The University of Manchester came first in the overall table after achieving first place for work towards both SDG 11 (Sustainable cities and communities) and SDG 12 (Responsible consumption and production) and second place for SDG 14 (Life below water).

Vice-Chancellor Dame Nancy Rothwell said the University of Manchester is “delighted to top the world” in the rankings, “but more importantly we’re pleased to be part of a growing community of universities committed to measuring and sharing their societal impact”.

She said the university values the feedback the rankings provide about their performance on each of the global goals.

“They cover every aspect of a university’s impact: our research, our teaching and learning, our engagement with the public and how we operate as sizeable organisations in our cities and regions.”

Top 10 institutions overall

The top 10 institutions overall are: University of Manchester, UK (1), University of Sydney, Australia (2), RMIT University, Australia (3), La Trobe University, Australia (4), Queen’s University, Canada (5), University of Wollongong, Australia (=6 or tie 6th), Aalborg University, Denmark (=6), University College Cork, Ireland (8), Arizona State University (Tempe), US (=9) and University of Auckland, New Zealand (=9).

While Western countries dominate the top 10, 24 countries and regions from six continents appear in the overall top 100, demonstrating a high level of commitment and excellence across global higher education for achieving the SDGs.

Phil Baty, chief knowledge officer at THE, says the rankings – with a record 1,240 universities participating this year but 1,115 institutions ranked – demonstrate that universities are showing “just how important they are to helping global society solve some of its toughest challenges”.

He said: “The results of this year’s rankings demonstrate the cohesiveness of institutions worldwide for a single shared goal, with representatives from 24 countries and regions, and six continents in the top 100 alone.”

All of Australia’s entrants appear in the overall top 200, while the University of Sydney comes first in SDG 6 (Clean water and sanitation), the University of Canberra tops the table for SDG 10 (Reduced inequalities), La Trobe University takes first place for SDG 15 (Life on land) and the University of Newcastle climbs from =82 last year to claim number one spot for SDG 17 (Partnerships for the goals).

Some 405 institutions entered the rankings for the first time, with Canada’s Queen’s University achieving fifth place overall and topping the ranking for SDG 1 (No poverty).

Top ranked universities by SDG

The number one ranked institution overall and for each SDG are:

• Overall: University of Manchester, UK.

• SDG 1 (No poverty): Queen’s University, Canada.

• SDG 2 (Zero hunger): Metropolitan Autonomous University, Mexico.

• SDG 3 (Good health and well-being): Oregon Health and Science University, US.

• SDG 4 (Quality education): Aalborg University, Denmark.

• SDG 5 (Gender equality): Princess Nourah bint Abdulrahman University, Saudi Arabia.

• SDG 6 (Clean water and sanitation): University of Sydney, Australia.

• SDG 7 (Affordable and clean energy): King Mongkut’s University of Technology Thonburi, Thailand.

• SDG 8 (Decent work and economic growth): University of Johannesburg, South Africa.

• SDG 9 (Industry, innovation and infrastructure): Four universities tied in first place: University of British Columbia, Canada; Delft University of Technology, Netherlands; Technical University of Munich, Germany; and University of Toronto, Canada.

• SDG 10 (Reduced inequalities): University of Canberra, Australia.

• SDG 11 (Sustainable cities and communities): University of Manchester, UK.

• SDG 12 (Responsible consumption and production): University of Manchester, UK.

• SDG 13 (Climate action): University at Buffalo, US.

• SDG 14 (Life below water): University of Plymouth, UK.

• SDG 15 (Life on land): La Trobe University, Australia.

• SDG 16 (Peace, justice and strong institutions): Queen’s University, Canada.

• SDG 17 (Partnerships for the goals): University of Newcastle, Australia.

Professor Tshilidzi Marwala, the vice-chancellor and principal of the University of Johannesburg, South Africa, said its top ranking for SDG8 – after coming 48th last year – was an “exceptional feat”, but its work in tackling global issues was also demonstrated by its top 100 ranking overall, in 92nd place.

He said the university remains “steadfast in supporting the UN SDGs through our research, teaching and learning, community outreach and engagement, stewardship and knowledge transfer”.

La Trobe University Vice-Chancellor Professor John Dewar AO said the rankings were an “outstanding endorsement” of the university’s commitment to improving quality of life, health outcomes and the environment through high-impact research, teaching innovation and meaningful partnerships on a local, national and global scale.

“Coming first in the world for protecting life on land highlights La Trobe’s leading role in investigating better ways to produce high-quality foods and medicines while reducing environmental impact and restoring vulnerable ecosystems.”

He said the rankings reflect how closely La Trobe’s values and ambitions “resonate with important global issues and the very real work we are doing to align with and advance the UN’s Sustainable Development Goals”.

Russia is most represented country

Russia (86) is the most represented country or region in the rankings, with an additional 33 universities ranked in at least one SDG table since 2020. Japan has 85 ranked institutions, followed by India (57), Turkey (55), UK and US (both 52), Brazil (47), Pakistan and Spain (both 40) and Iraq (38).

Baty said: “The THE Impact Rankings offer a platform for universities in every corner of the planet to showcase their active commitment to sustainability. The record turnout this year shows how universities are standing up to be counted and fulfil the vital role they play in society.

“Success in any of the SDGs means being responsible at every level, from the individual institutions, all the way up to the multinational. Therefore, we are thrilled to see the growing number of debutants who have qualified this year, as it shows just how seriously they are taking their roles in helping to ensure a sustainable future.”

In this year’s ranking postgraduate-only institutions were included for the first time.

A ‘catalyst for action’

According to THE Chief Data Officer Duncan Ross in his explanation of the methodology, it is hoped that the rankings “can be a catalyst for action, a mechanism for holding our universities to account, and an opportunity for them to highlight great work that they are already doing.”

The THE Impact Rankings assess universities on metrics across all 17 UN SDGs. Data was collected from universities and Elsevier and the metrics were developed in partnership with Vertigo Ventures.

The findings are displayed in 18 league tables, one for each of the 17 individual SDGs and one overall ranking table. To appear in the overall ranking table, universities must have submitted to SDG 17 (Partnerships for the goals) and a minimum of three other SDGs.

According to THE, a university’s final score in the overall table is calculated by combining its score in SDG 17 with its top three scores out of the remaining 16 SDGs. SDG 17 accounts for 22% of the overall score, while the other SDGs each carry a weight of 26%. This means that different universities are scored based on a different set of SDGs, depending on their focus.

A university’s contribution to individual SDGs is assessed on the basis of research metrics (27%) and other evidence-based criteria. So, for instance SDG 1 (No poverty) is based on research on poverty including scale and citations, as well as the number of papers co-authored with a university based in a low- or middle-income country; other factors are the proportion of students receiving financial aid; and evidence of university anti-poverty programmes providing student support and community support.

Comparison with previous years’ rankings is difficult because the number of participant institutions increased by 211 (or 38%) from 556 in 2019 to 767 in 2020 and further increased to 1,240 this year; secondly, the number of SDGs included rose from 11 to 17 between 2019 and 220, increasing the number of metrics ranked.

Monday, February 22, 2021

A century that profoundly changed universities and their campuses

by Geoff Hanmer, The Conversation: https://theconversation.com/profiles/geoff-hanmer-90647

This history of the development of universities is the first of two articles on the past and future of the campus. This is a long read, so set aside the time to read it and enjoy.


Image: The Conversation

Once the first atomic bomb exploded on 16 July 1945 in New Mexico, the world would never be the same again. Scientists and engineers had turned an obscure principle into a weapon of unprecedented power. Los Alamos, the facility where the bomb was designed, was run by the University of California.

This was a turning point for universities. As they increasingly focused on scientific research, the role of universities worldwide - and their campuses - changed.

Before the first world war, the largest investment on most campuses was the university library. After the second world war, investment shifted decisively to laboratories and equipment.

A key reason for the increasing focus on university research was the lessons of the first world war. After the war, governments of rich countries took an increasingly interventionist role in directing and encouraging the research and development of artificial materials, weapons, defences and medicine. Universities or institutes associated with universities did much of this work.

By 1926, the Council for Science and Industrial Research, the predecessor to the CSIRO, and the organisation that would become the National Health and Medical Research Council (NHMRC) had been founded in Australia.

A gradual turn towards research

In the UK, many of the older universities were not that keen on applied research. Chemistry, engineering and physics were taught at Oxford between the wars, but by 1939 the chemistry cohort was just over 40 students, of whom “two or three were women”.

It wasn’t until 1937 that Oxford drew up a plan to develop the “Science Area” with new buildings, but in that same year, the university also agreed to reduce its size to avoid a fight with the Town over “further intrusion on the Parks”.

Facilities at Cambridge for physical sciences were slightly better, but not by much, despite its historical focus on mathematics. The Cavendish laboratory in which the New Zealander Ernest Rutherford discovered in 1911 that the atom had a nucleus was small, dark, damp and ill-equipped.

The room used by Ernest Rutherford for his atomic research
A century ago, universities provided modest facilities for researchers like Nobel laureate Ernest Rutherford. Science Museum London/Wikimedia Commons, CC BY-SA

This relative lack of interest in experimental sciences at  Oxbridge was unhelpful for science research in Australia, because our six small state-run universities tended to follow their lead. As an indication of its priorities, the University of Adelaide built its humanities buildings in stone and its much more modest science facilities in brick.

Nobel laureate and University of Adelaide Professor W.H. Bragg carried out his pioneering experiments on X-ray crystallography in Adelaide during 1900 to 1908 in a converted storeroom in the basement of the Mitchell Building. His lab is now a storeroom again.

The post-war transformations

The application of university research had been a German strength since well before the first world war with the rise of the Humboldtian model of higher education, which favoured research over scholarship. A key reason the Allies prevailed in 1945 was that the United States in particular rapidly improved its capacity to carry out and apply research, based on the Humboldtian model.

In 1917, MIT established a naval aviation school. The University of Washington soon followed MIT’s example.

This decision had a direct bearing on the success of the Boeing company following construction of the Boeing wind tunnel at the University of Washington’s Seattle campus in 1917. It led directly to the development of advanced aerodynamics for the Boeing 247 of 1933, which provided the template for all subsequent commercial airliners.

The Australian university system between the wars offers no such exemplars. The focus on applied research was foreign to the prevailing university culture in Australia at the time. As  Hannah Forsyth writes in A History of the Modern Australian University, not until the 1940s did “scholarly esteem began to move away from ‘mastery’ of disciplines towards the discovery of new knowledge”.

Boeing 247 aeroplane on the runway
The wartime construction of a wind tunnel at the University of Washington enabled development of the Boeing 247, which provided the template for commercial airliners. Ken Fielding/Flickr, CC BY-SA

New research facilities and new campuses

New technologies led to a host of new post-war industries, including commercial aviation, television, plastics, information technology (IT) and advanced health care. The demand for skills to operate these new industries was the primary driver of an explosion in university enrolments.

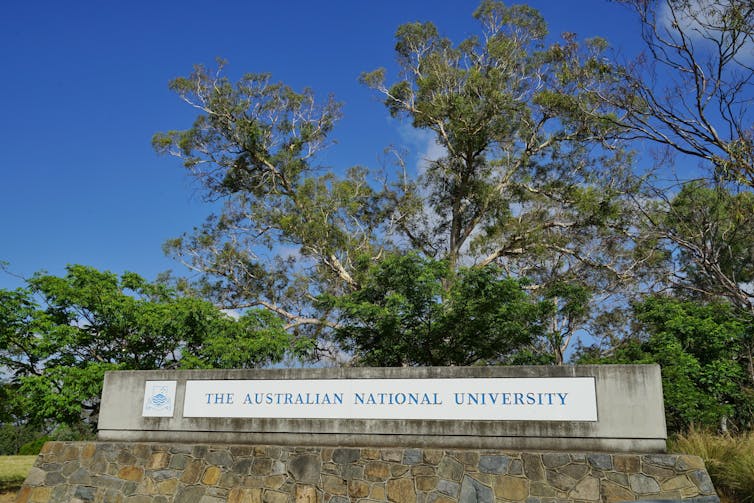
University science research in Australia only got a serious start in 1946 with the foundation of the Australian National University (ANU) and the Commonwealth Universities Grants Committee, which became the Australian Research Council (ARC).

Australian National University sign on Canberra campus
The founding of the Australian National University in 1946 marked a shift in Australia towards more research-focused universities set on very large campuses. EQRoy/Shutterstock

As Robert Menzies, the prime minister from 1949-66, later wrote:

The Second World War brought about great social changes. In the eye of the future observer, the greatest may well provide to be in the field of higher education.

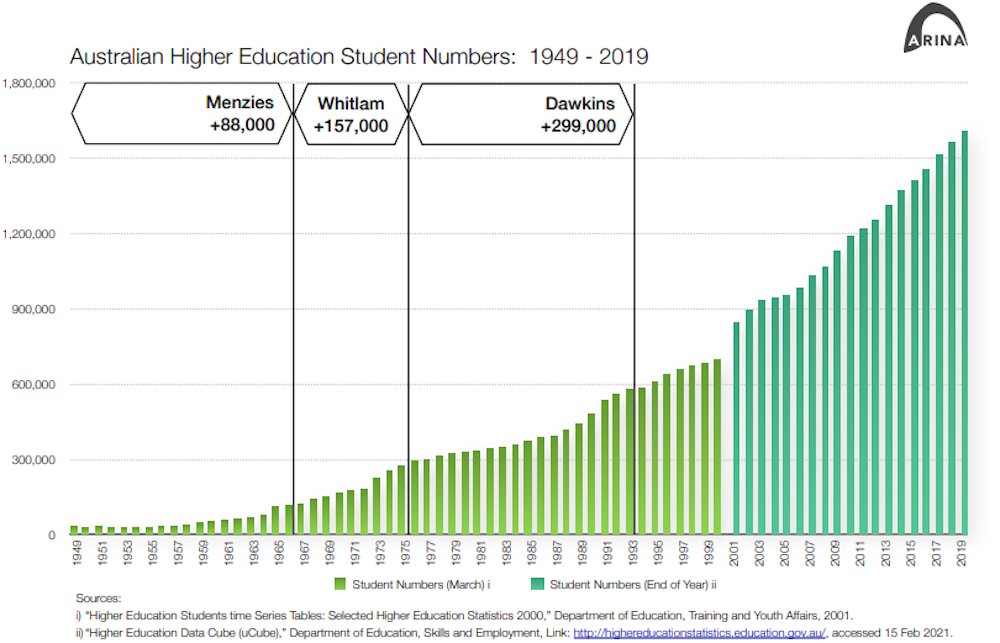
In Australia, about 80% of our universities have been founded since the second world war. The growth of the sector has been startling.

chart showing postwar growth in university student numbers in Australia
Author provided

All of the institutions founded during the Menzies era were sited on large campuses in the suburbs or beyond. Although mainly Commonwealth-funded, they were designed and delivered by state public works authorities to tight budgets on land provided largely by state governments. UNSW, Monash, Griffith, La Trobe, Flinders and WAIT (now Curtin) share a heritage of economical buildings on large parcels of land.

The key reasons for this approach were to minimise cost and maximise capacity for growth and change. Low to medium-rise buildings on land surplus to state needs maximised bang for buck. Development costs per square metre of building were about half that of a campus in the central business district (CBD) of cities.

This was not a new discovery. The universities of Stanford, Berkeley, Caltech, Tokyo, Wisconsin and Peking, all founded in the 19th century, used this model for similar reasons.

Fortunately, the states were generous with land they didn’t need. Of all the universities built in the Menzies era, only UNSW with 39 hectares has a significant land area constraint. The other universities have at least 50ha and several have well over 100ha. This has given them some headaches, but also lots of options.

Research by ARINA, an architectural firm specialising in higher education, community and public design, shows that virtually all universities built since 1949 - that’s more than 90% of universities in the world - have large campuses with densities less than 500 students per hectare. The University of Bath, built in 1966, is typical of post-war UK universities with 59ha and 16,000 students in 2021, less than 300/ha.

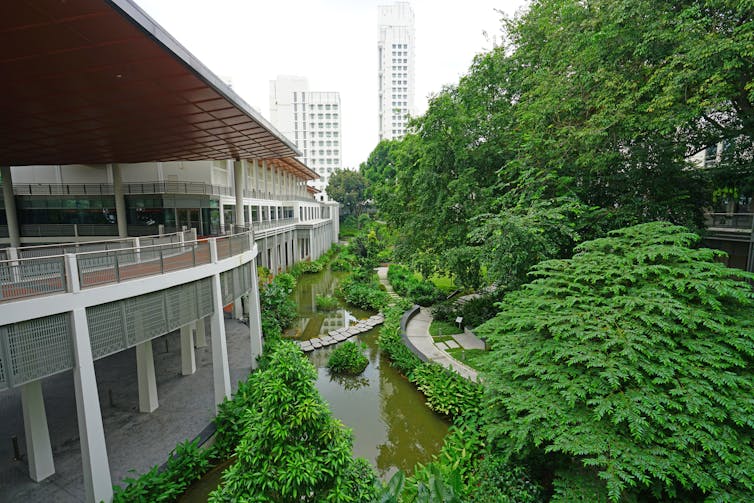
The same is true even in small city-states such as Hong Kong and Singapore. The National University of Singapore has a campus of about 140ha with 37,000 students (264/ha) and Hong Kong University of Science and Technology has 55ha with 11,000 students (200/ha).

Campus of National University of Singapore
The National University of Singapore has a campus of about 150ha despite the city-state’s small area. EQRoy/Shutterstock

Most new universities in Europe, Asia, India and the Middle East still rely on the large campus model. The University of Paris-Saclay, for example, is being built on 189ha of former farmland 15km south of the Paris orbital motorway.

Broad-acre campuses are popular with students as measured by surveys of educational experience such as the Australasian Survey of Student Engagement (AUSSE) and the US National Survey of Student Engagement (NESSE). The most popular campuses in Australia are Bond, New England, Griffith and Notre Dame. RMIT and UTS, the highest-ranked CBD campuses finish in the middle of the pack, a long way behind the leaders. A similar phenomenon can be seen in the UK and the US.

Campus model goes corporate

The ARINA research indicates broad-acre campus models have also become increasingly part of the physical organisation and accommodation of many commercial operations.

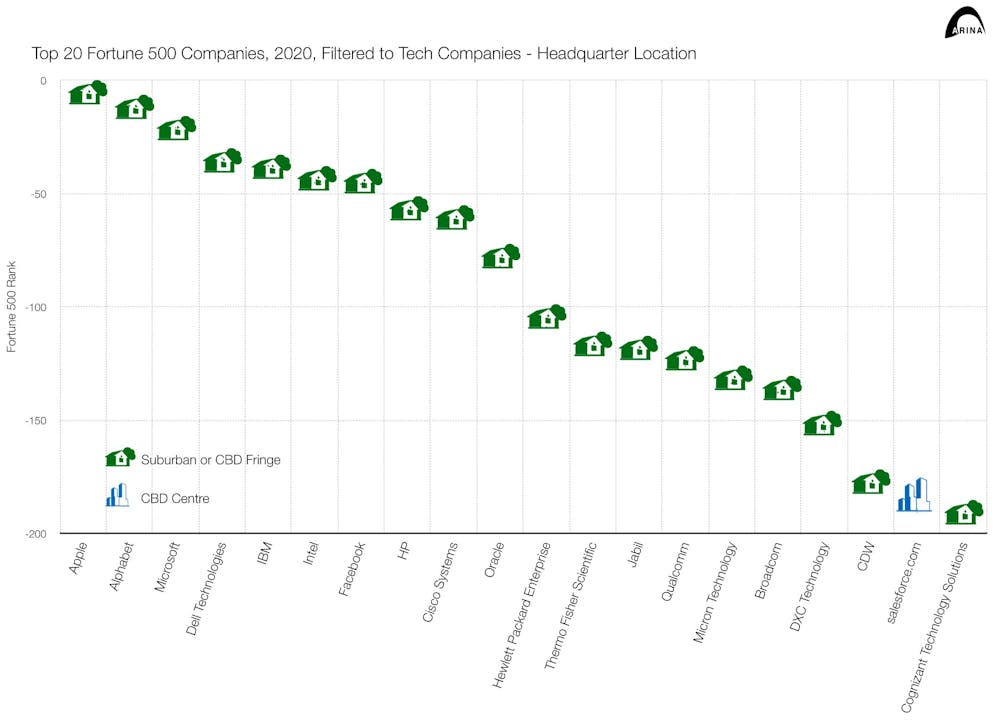
In 2020, 63% of the top 30 US Fortune 500 index and 87% of the top 30 tech companies in the index were located in suburban and extra-urban settings, mostly campuses. This includes well-known tech companies such as Apple, Alphabet, Facebook, Tesla and HP, but also less obvious candidates such as Walmart, Exxon Mobil and Amazon.

Chart showing locations of top 20 Fortune 500 tech companies
ARINA, Author provided

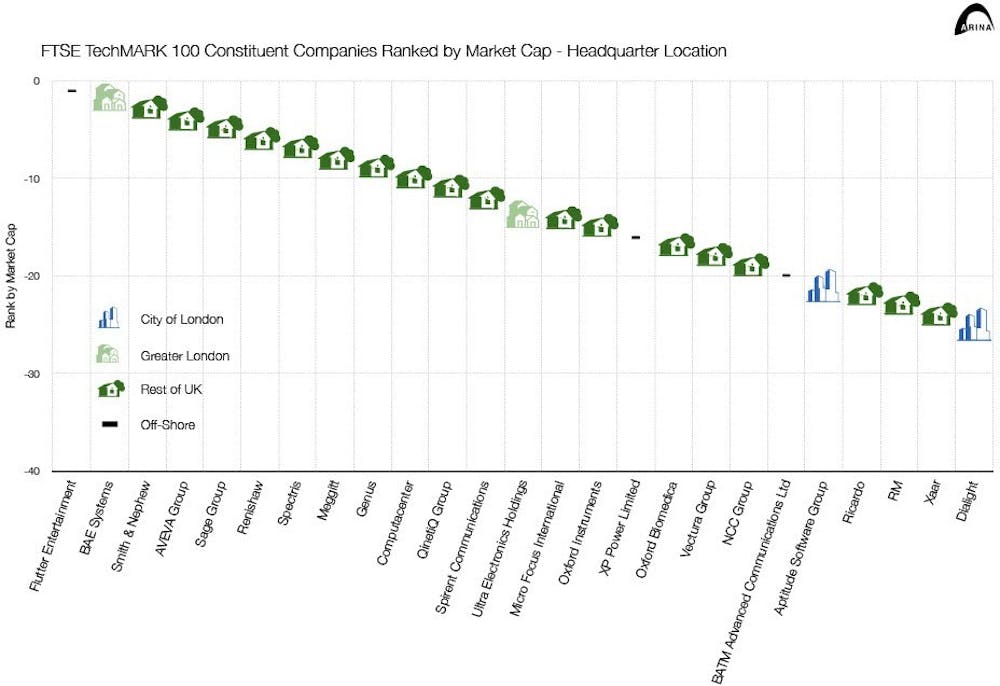
In the UK, 28% of all FTSE 100 companies and 54% of FTSE Techmark 100 companies by market capitalisation are based outside greater London.

Chart showing locations of top 20 tech companies in the UK
ARINA, Author provided

The reasons for this are straightforward: capital and operating costs for research-based firms are lower outside a CBD. While some Australian universities are choosing to head into the city, much of the new economy appears to be heading for the suburbs. It’s happening for the same reason that universities started to migrate there over a hundred years ago.

Monday, February 8, 2021

Which universities are best placed financially to weather COVID?

by Omer Yezdani, The Conversation: https://theconversation.com/which-universities-are-best-placed-financially-to-weather-covid-154079

Image: The Conversation

2021 is when the impacts of COVID-19 really start to take their toll on universities, as more than 140,000 international students seek to return to study in Australia. My new analysis, presented in this article, reveals that if one in five international students don’t re-enrol, the loss of revenue would plunge half of all Australian universities into financial turmoil or budget deficit. While the impacts of COVID are unprecedented, modelling universities’ financial resilience shows which institutions fare better and why.

International students generated A$10 billion in fee revenue  for universities in 2019. This in turn drives jobs, local industry,  research and Australia’s reputation as a destination for quality higher education.

Recent modelling by the Mitchell Institute estimated more than 300,000 fewer international students would be studying inside Australia by mid-year, if travel restrictions continued.

Universities employ more than 130,000 staff at 200 campus locations across Australia. Many of these jobs could be at risk. Universities Australia figures show at least 17,300 have already been lost.

Revenue and reputation: a self-reinforcing cycle

In total, 32% of all full-time-equivalent enrolments at Australian universities are international students. About a quarter (24%) of all university revenue comes from these students. Universities’ operating revenue fell 4.9% in 2020, with an estimated 5.5% fall to come in 2021.

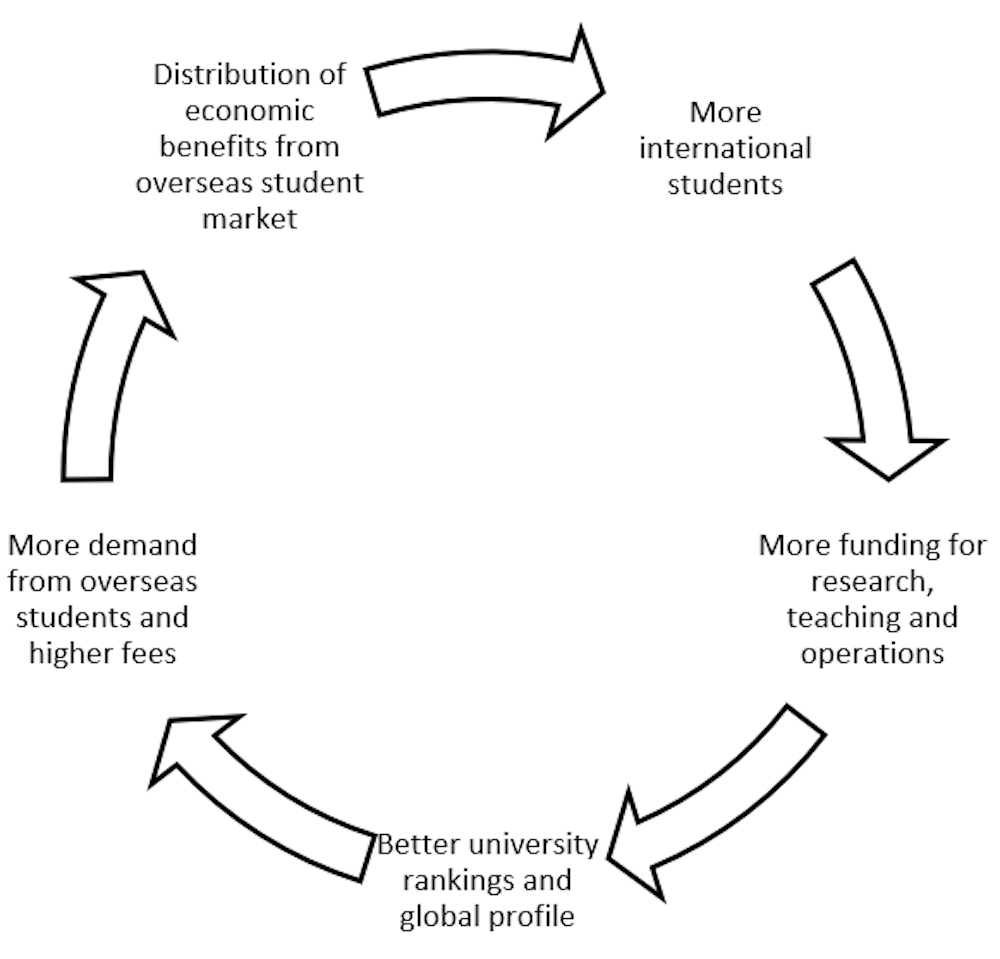
International student fees are correlated with university rankings but are also a self-reinforcing cycle: more international students generate more revenue to fund more research, which in turn leads to better rankings and more demand.

Chart showing links between student fee revenue, university resources and reputation.
International student revenue increases university resources, which enhances reputation, which in turn attracts more international students. Author provided

Another risk factor for universities is the concentration of enrolments from just a few source countries. They are also concentrated in the largest institutions. One in four international students (25%) study at one of these five universities: Monash, RMIT, Melbourne, Sydney or UNSW.

The leading source of international students in Australia is China, with 36% of these students. It’s followed by India (14%), Malaysia (7%), Singapore (5%) and Nepal (4%). Just one or two geographic markets dominate international enrolments at most universities.

International students aren’t the only risk factor

The worst-hit universities may be those with small pre-COVID operating margins and high reliance on concentrated international student revenue.

My analysis shows a 20% fall in international student fee revenues would leave 22 universities in deficit or on the brink with a net operating result (revenue minus expenses) of 1% or less.

Those with a higher reliance on international students, less diverse revenue streams or a lower return on equity fare worse in the post-COVID modelling. The chart below shows the impact on university net operating results of five scenarios involving decreases in international students by 10%, 20%, 30%, 40% and 50%.

The net result decreases more dramatically for those with both a high reliance on international students and a limited operating buffer. In other words, the risks already existed – COVID amplified them.

Universities need a buffer to absorb shocks

Many Australian universities rely heavily on revenue from international students as part of their business model and global profile. Twelve rely on international student fees for more than 30% of their total income.

Table of universities that receive more than 30% of their total revenue from international student fees
Data source: Department of Education, Skills and Employment, Finance Tables, Author provided

While all the universities in the above table are registered not-for-profits, they need to remain financially sustainable. Any organisation involved in high-stakes global markets should have a buffer against rare and unexpected shocks such as the COVID pandemic. A requirement for financial buffers was legislated in the US following the global financial crisis but still remains a vexed issue.

The average net pre-COVID operating result for Australian universities was a healthy 5.6%. However, several started the year with a result of less than 1%. These universities included Charles Darwin (-3.1%), Notre Dame (-2.6%), New England (-1.4%), Macquarie (0.14%), Central Queensland (0.71%) and Charles Sturt (0.77%).

These results raise important questions for university boards. What is a responsible operating result considering the risks of the business and the markets in which it operates? Was “pandemic” already identified in risk registers? And what was done about it?

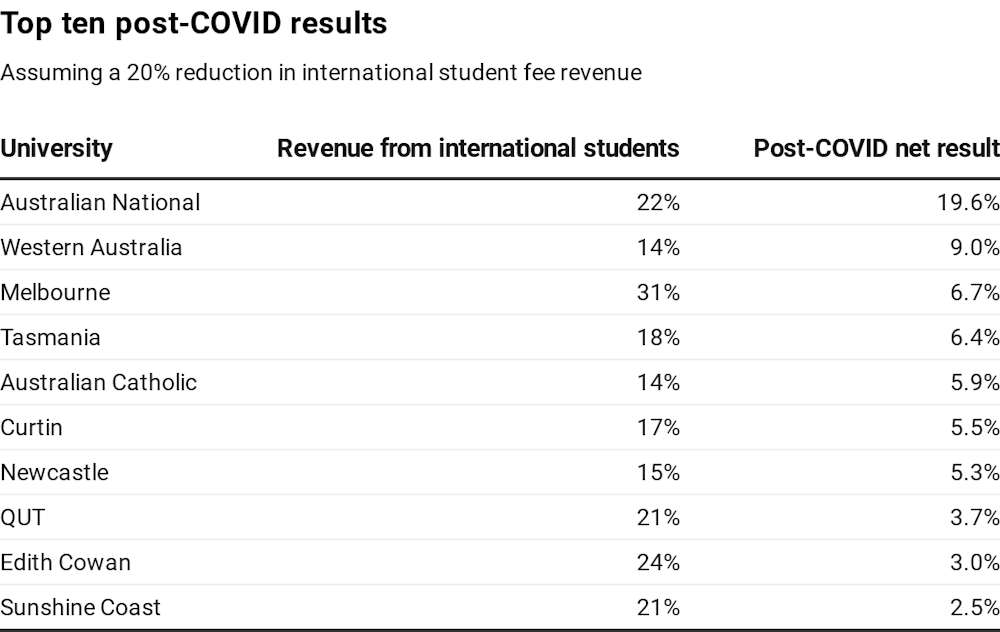
Significant revenue write-downs leave institutions with only a few levers to buffer the COVID shock while minimising risks to quality.

Chart showing top 10 operating results for universities assuming a 20% fall in international student fee revenue
Author analysis of modelling using data from Department of Education, Skills and Employment, Finance tables

On average, the above top ten universities generate 20% of their revenue from international student fees. The sector average is 24%.

The University of Melbourne gets 31% of its revenue from international student fees. That’s higher than the average, but its very healthy pre-COVID operating result of 13.9% provides breathing space.

Newcastle, QUT, Edith Cowan and the Sunshine Coast are in the top ten universities, but under this model have a potential post-COVID result of less than the sector average of 5.6%. Their risk exposure to international student fee revenue is still average or lower.

How should universities respond?

Three main conclusions can be drawn.

First, to underpin their financial sustainability and avoid risks to quality, universities must consider not only their reliance on international student fee revenue and market concentration, but also strategies to understand and define their appetite for risk.

Second, the model for online education when travel across borders is limited could be a long-lasting effect of COVID. Long-term strategies and regulatory practices to deal with this “new normal” of global higher education will be needed, beyond temporary regulatory flexibility.

Third, disruption to higher education is here to stay. Waiting for a time when the view on the horizon is clear for all to see may be too late.

Global higher education requires a new organisational ambidexterity. That means universities must revisit core operating models, re-imagine future potential and succeed on the disruptive edge.


Note: Department of Education, Skills and Employment finance tables used for this analysis may differ from institutional reports due to various accounting methods.